Periodic table charts
Each chart colours the periodic table by one property and prints the value on every element, followed by the full table of values and an explanation of the trend. They are free to use in class.
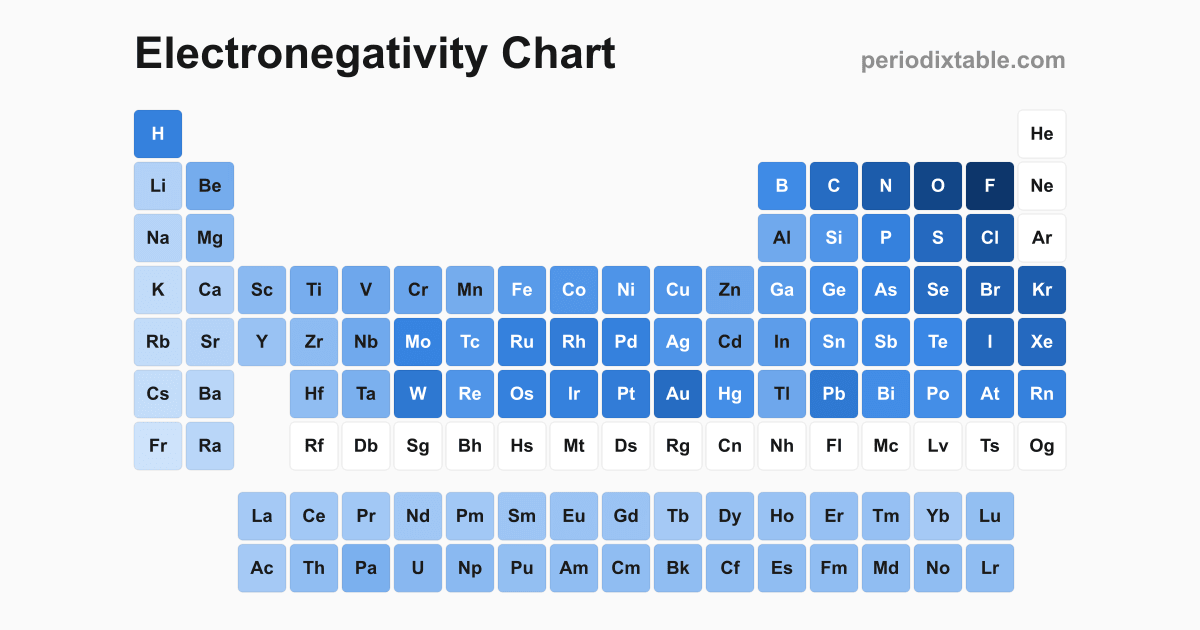
Electronegativity chart
Electronegativity measures how strongly an atom pulls shared electrons toward itself in a chemical bond. This chart shows the Pauling electronegativity of every element that has one.
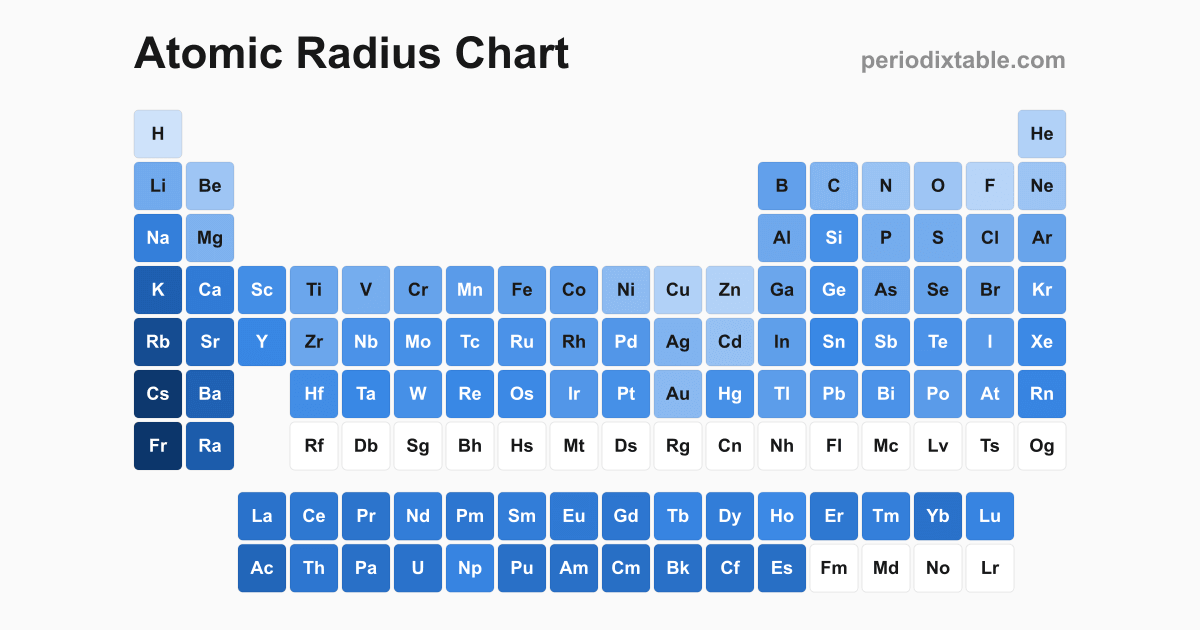
Atomic radius chart
Atomic radius is the distance from the nucleus to the outer edge of an atom’s electron cloud, given here in picometres (1 pm = 10⁻¹² m).
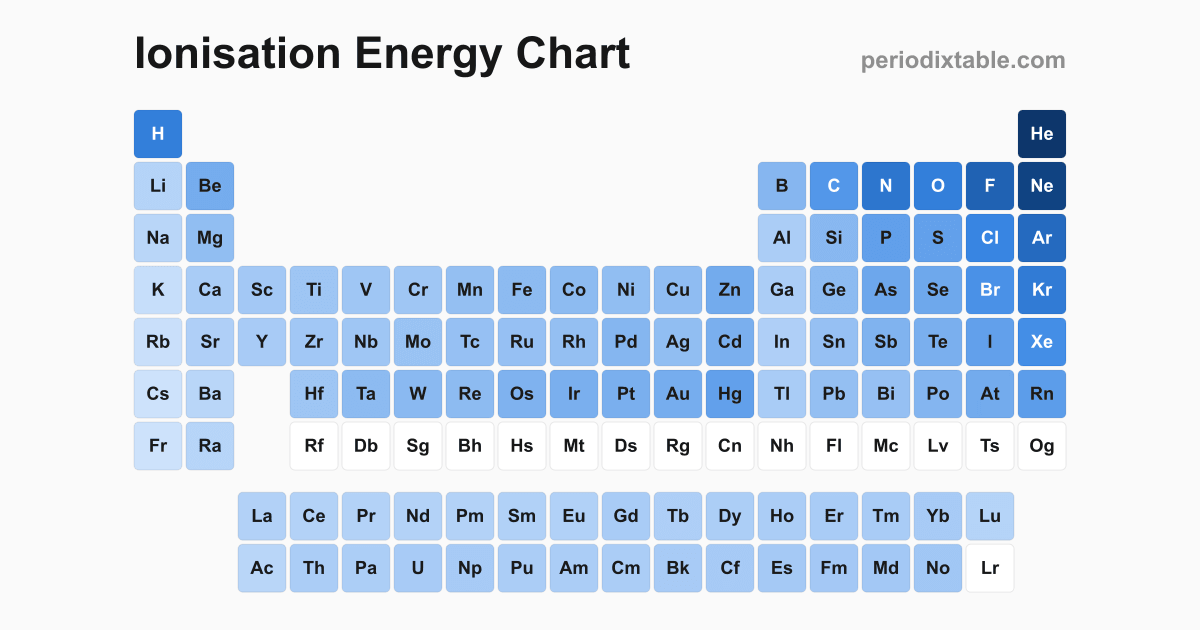
Ionisation energy chart
First ionisation energy is the energy needed to remove the most loosely held electron from a neutral atom in the gas phase. Values are in electronvolts (eV); the table also gives them in kJ/mol.
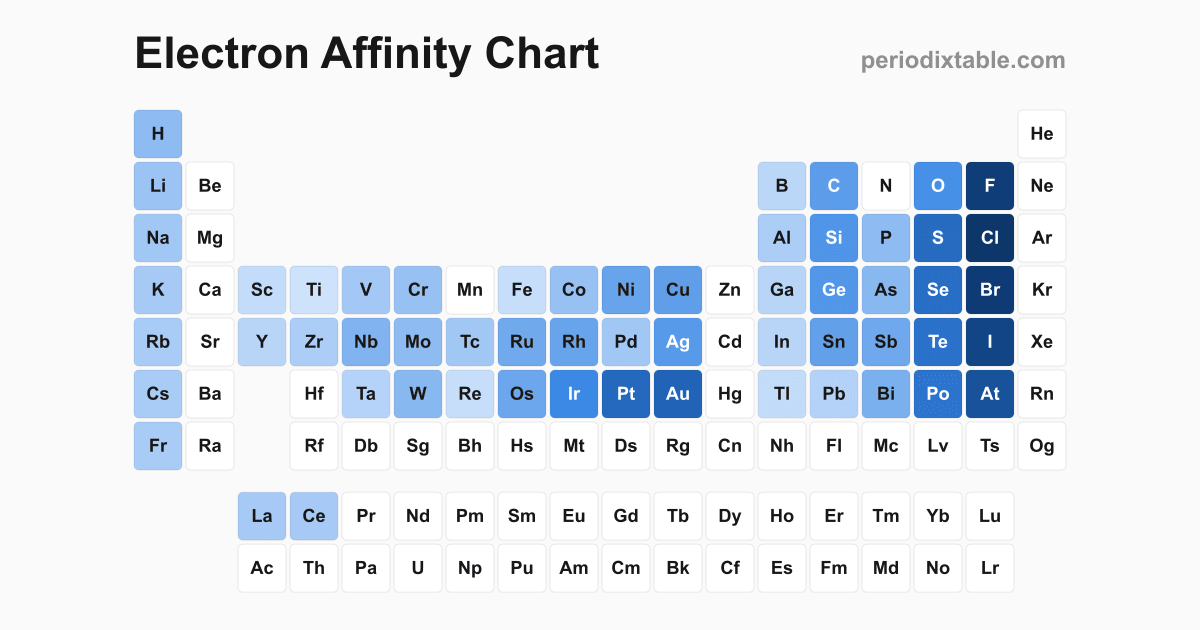
Electron affinity chart
Electron affinity is the energy released when a neutral atom in the gas phase gains an electron to form a negative ion, in electronvolts (eV). A larger value means the atom holds the extra electron more strongly.
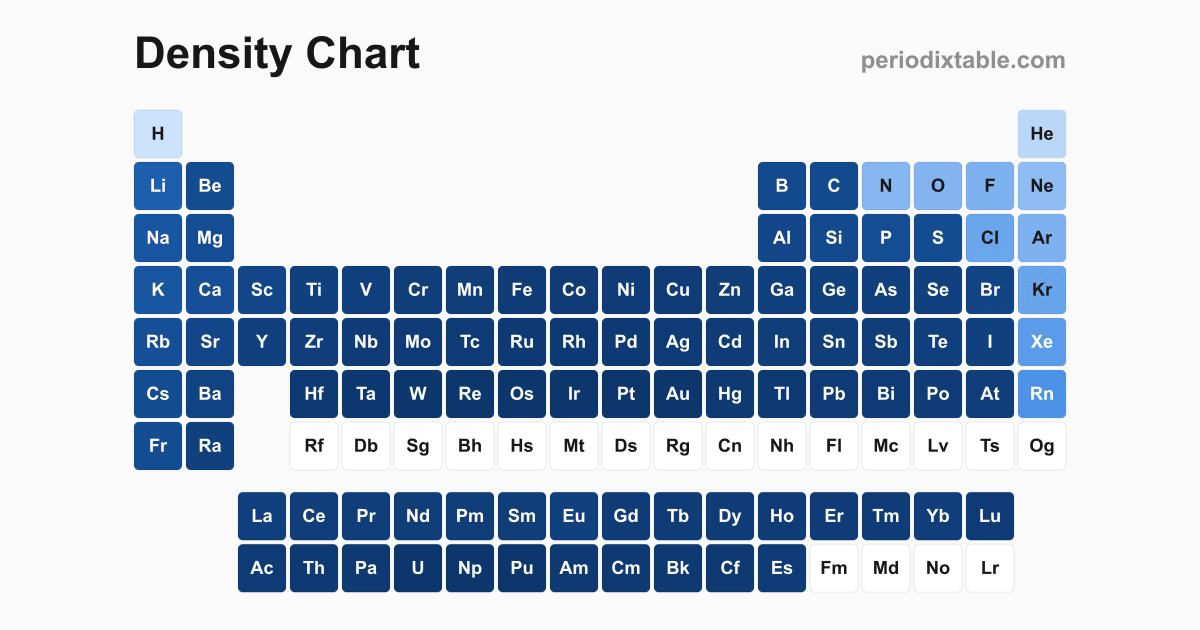
Density chart of the elements
Density is mass per unit volume, shown in grams per cubic centimetre (g/cm³). Solids and liquids are measured near room temperature and gases at 0 °C and normal pressure, which is why gas values are so small.
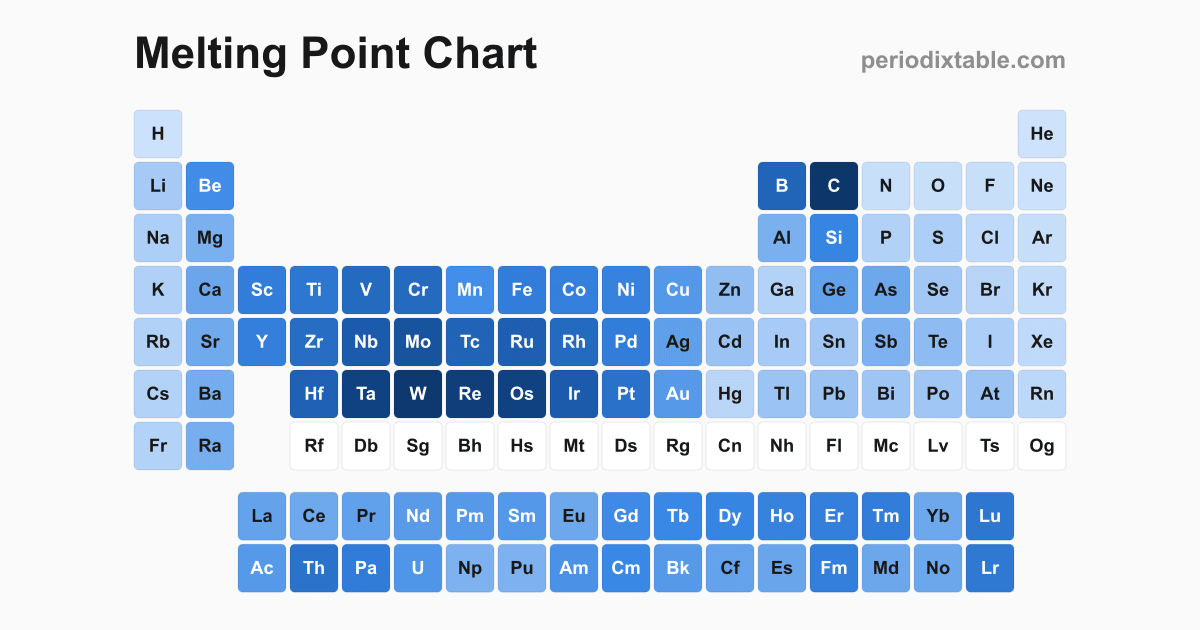
Melting point chart
The melting point is the temperature at which a solid turns into a liquid at normal atmospheric pressure. The chart shows it in degrees Celsius; the table also gives kelvin and Fahrenheit.
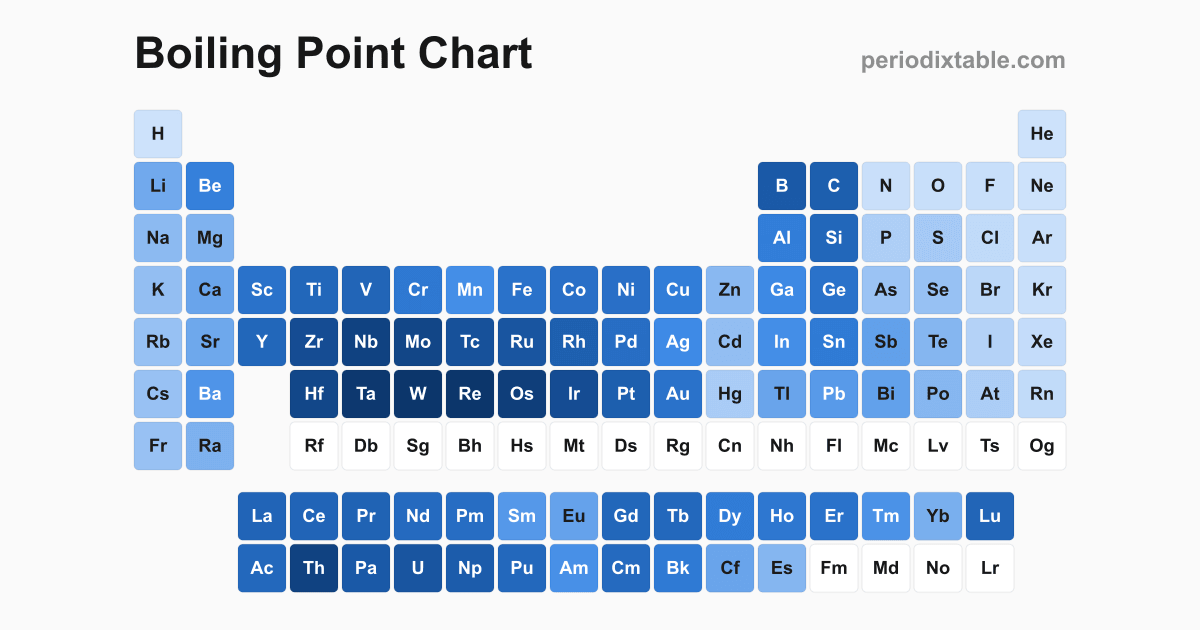
Boiling point chart
The boiling point is the temperature at which a liquid turns into a gas at normal atmospheric pressure. The chart shows it in degrees Celsius; the table also gives kelvin and Fahrenheit.
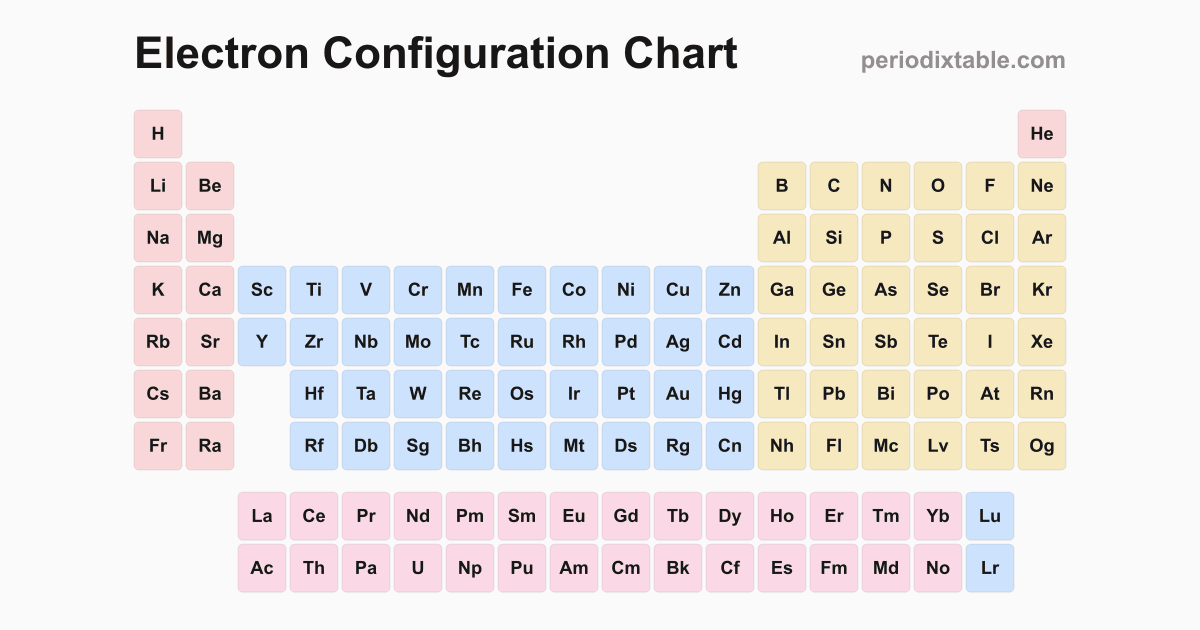
Electron configuration chart
An electron configuration lists how an atom’s electrons fill its orbitals. Each tile shows the outer part of the configuration; the noble-gas core written in brackets before it, such as [Ar], stands for all the electrons of that noble gas.
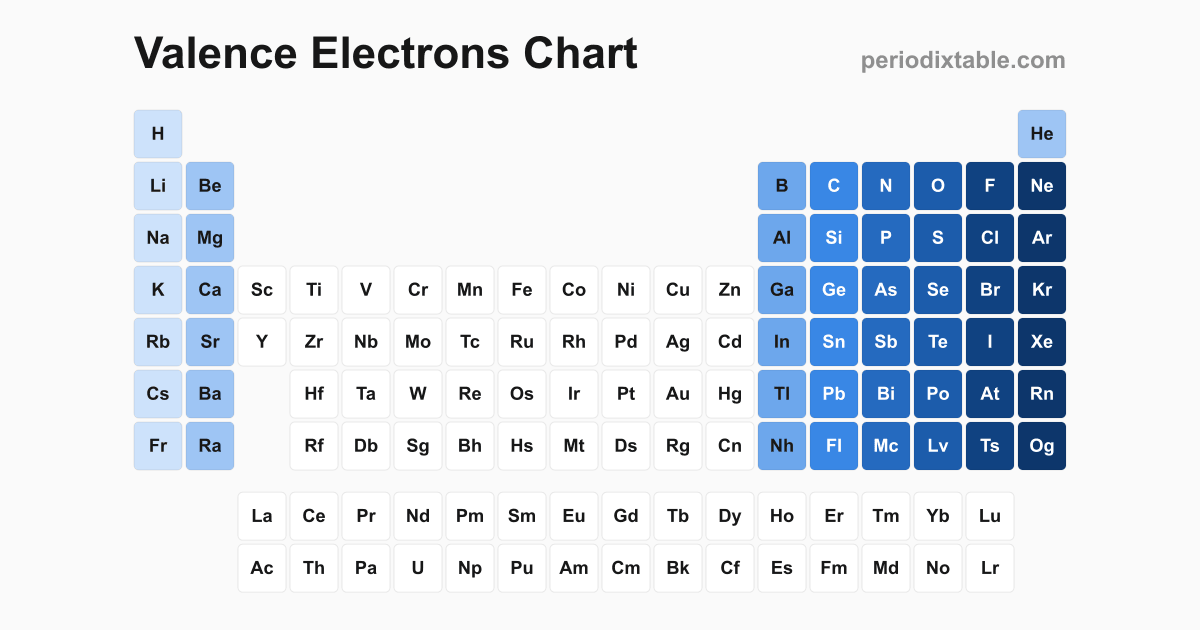
Valence electrons chart
Valence electrons are the electrons in an atom’s outer shell, the ones that take part in chemical bonds. For main-group elements their number follows the group.
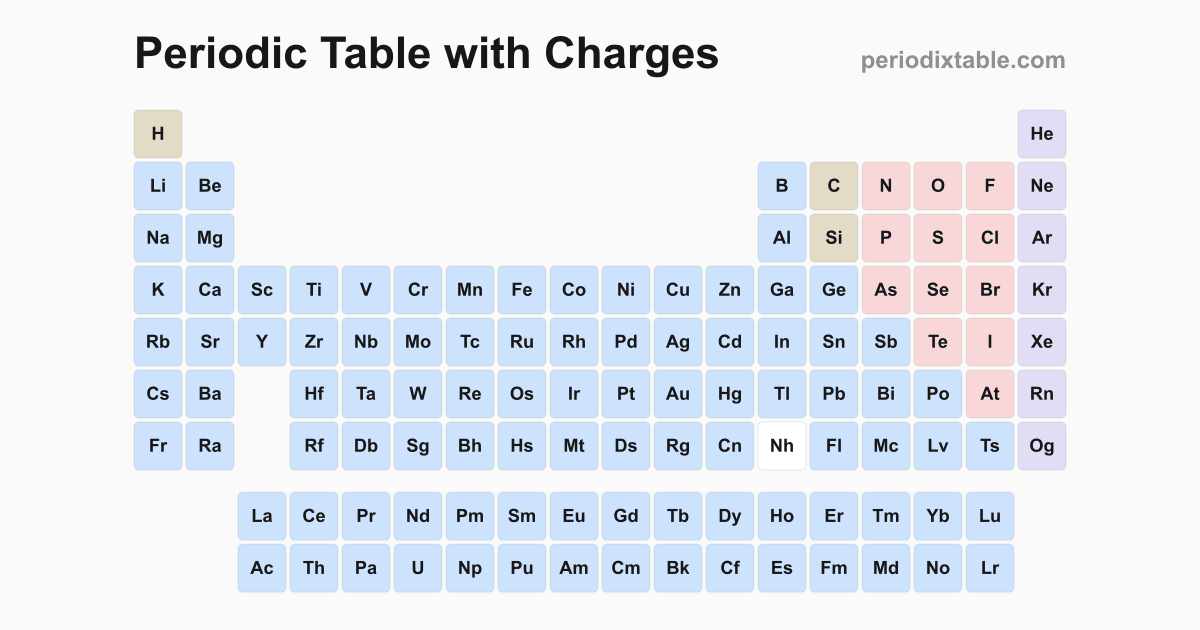
Periodic table with charges
This periodic table shows the charge of the ions each element most commonly forms. Metals lose electrons and form positive ions; nonmetals gain electrons and form negative ions.